
Autism Spectrum Disorder (ASD) is a developmental disorder that impacts how an individual interacts with the world in many ways. As with any condition, no two people with ASD are completely alike, and by the nature of being on a spectrum, there are many varying degrees and manners in which the disorder may present itself. A common trait of individuals on the autism spectrum is difficulty with typical social pragmatics such as reading body language, knowing when to give someone else a turn in a conversation, or making appropriate eye contact (Centers for Disease Control and Prevention, 2023). These issues can make life more difficult for individuals on the spectrum, as they may struggle to form appropriate social relationships and are impaired in situations such as job interviews, working customer service, and other contexts.
Research has found that these differences in social behaviors also manifest themselves in the form of atypical social attention. Here, social attention refers to the level of attention that individuals with autism pay to socially-charged versus non-socially-charged stimuli when compared to neurotypical individuals. For example, Shic et al. (2014) found evidence supporting differences in social attention that start from infancy. Researchers used eye tracking to observe facial attention tendencies in infants, some of whom went on to develop ASD, and some of whom did not. Infants who went on to develop ASD (assessed at age three) paid less attention to faces overall than their neurotypical counterparts, and their attention decreased further when presented with a face that was speaking. Researchers concluded that individuals on the autism spectrum tend to have difficulty “regulating attention to complex social scenes” (Shic et al., 2014, p. 232).
Another study on social attention was conducted by Dubey et al. (2015). This group of researchers aimed to test social motivation theories of autism, which attribute differences in social attention to a lack of desire for socialization in individuals on the spectrum. In a computerized task, participants were given a choice between two different videos to watch, and had to apply effort in order to play their video of choice. Dubey et al. used videos of objects, videos of a person whose gaze was averted from the camera, and videos of a person whose gaze was directed at the camera. Experimenters found a preference in neurotypical adults for the social stimuli over the videos of objects. Among individuals with increased autism phenotypes, the preference for social stimuli was notably weaker. These differences in performance among neurotypical adults support the idea that it could be useful to observe autism phenotypes and social attention in individuals without an ASD diagnosis. In adults with ASD, researchers discovered significantly reduced interest in direct gaze videos, but similar levels of interest in averted gaze videos compared to individuals without ASD. (Dubey et al., 2015). These findings suggest not an aversion to social stimuli, but rather an aversion to direct gaze or eye contact, leading one to seek out alternate explanations for differences in social attention among individuals.
Jaswal and Ahktar (2018) are proponents of the idea that there are various reasons for a person with ASD to behave differently in social settings compared to people without ASD. For instance, there are many reasons that an individual might choose to avoid eye contact or direct gaze, among neurotypical populations as well as those with autism. Culture can have a strong influence on when or why to make eye contact, even from infancy (Jaswal & Akhtar, 2018). Within western culture, where making eye contact during conversation is considered the norm, it is often assumed that a lack of eye contact signifies a lack of interest in social interaction. However, Jaswal and Ahktar received reports that some people on the spectrum actually avoid eye contact as a means to better focus on what a speaker is saying. In these cases, the individual with autism is not lacking social motivation; they are actually using gaze avoidance as a means to participate more in social interactions than they would otherwise be able to. This is possible because, as multiple researchers have found, averting eye contact can help reduce cognitive load and allow an individual to focus more easily on other stimuli without becoming overwhelmed (Jaswal & Akhtar, 2018). Given these findings, one cannot conclusively explain the underlying causes of differences in social attention among individuals, whether observing individuals on the autism spectrum or even neurotypical individuals. More research on social attention tendencies is needed in order to enhance researchers’ and clinicians’ understanding of the reasons for said tendencies and when and how to provide interventions for individuals with autism.
Using the BAPQ and a spatial orienting task, the goal of the current study was to add to existing research on the correlation between autism phenotypes and social attention. We observed social attention behaviors among individuals who displayed varying levels of autism phenotypes, without asking them to report whether they have ever received an ASD diagnosis.
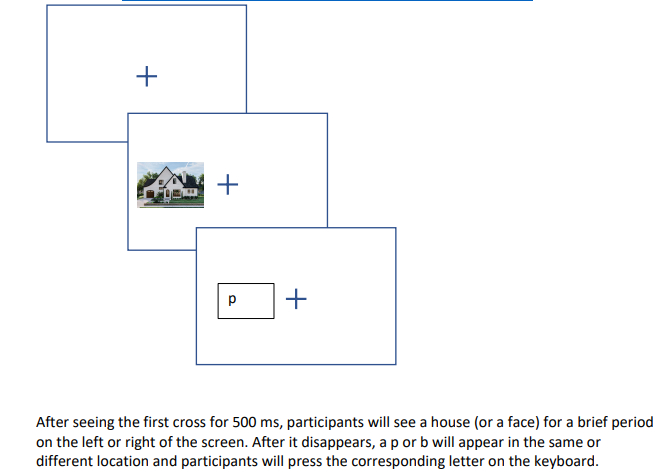
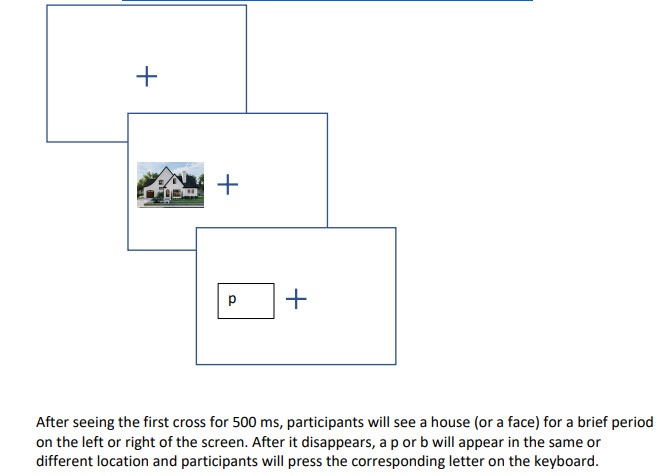
The spatial orienting task used in this experiment comes from the Spatial Orienting Paradigm outlined by Chita et al. (2014). In this method, participants see a screen with a fixation point in the center, and stimuli appearing on either side. The participant is first shown a stimulus that serves as an attentional cue. In this case, the attentional cue was either an image of a house or a face (non-social stimuli or social stimuli). As the term “attentional cue” suggests, this piece of stimuli is meant to attract the participant’s attention towards the area of the screen it is appearing on. Next, the target stimulus appears on screen. The amount of time that passes between the cue appearing on screen and the target appearing on screen is known as Stimulus Onset Asynchrony (SOA). The target can appear on the same side of the screen as the cue, or on the opposite side (Congruent or Incongruent). For the current experiment, the target stimulus was either the letter ‘p’ or the letter ‘b.’ Participants were asked to determine which of the two letters were on the screen and enter their response by selecting the corresponding letter on the keyboard. By measuring their reaction time in this task, we were able to observe how strongly their attention was drawn by the cue stimuli.
Based on the current literature on Autism Spectrum Disorder, we expected to observe a tendency in high BAPQ group individuals to avoid looking at images of faces, especially since these images were of direct gaze faces. This tendency would manifest itself in the form of a longer reaction time after being presented with non-social stimuli than with social stimuli, because the former would capture the individual’s attention more fully, distracting from the ‘p’ or ‘b’ task. Conversely, because past studies have supported the idea that neurotypical individuals, and especially those with lower levels of autism phenotypes, prefer social stimuli to non-social stimuli (Dubey et al., 2015; Shic et al., 2014), we expected to observe a tendency among participants in the low BAPQ group to pay more attention to the “faces” Image Type.
Methods
Participants: Participants included 66 NMSU students, of which 13 were men, 51 were women, and 2 were nonbinary individuals. The average age for participants was 18.8.
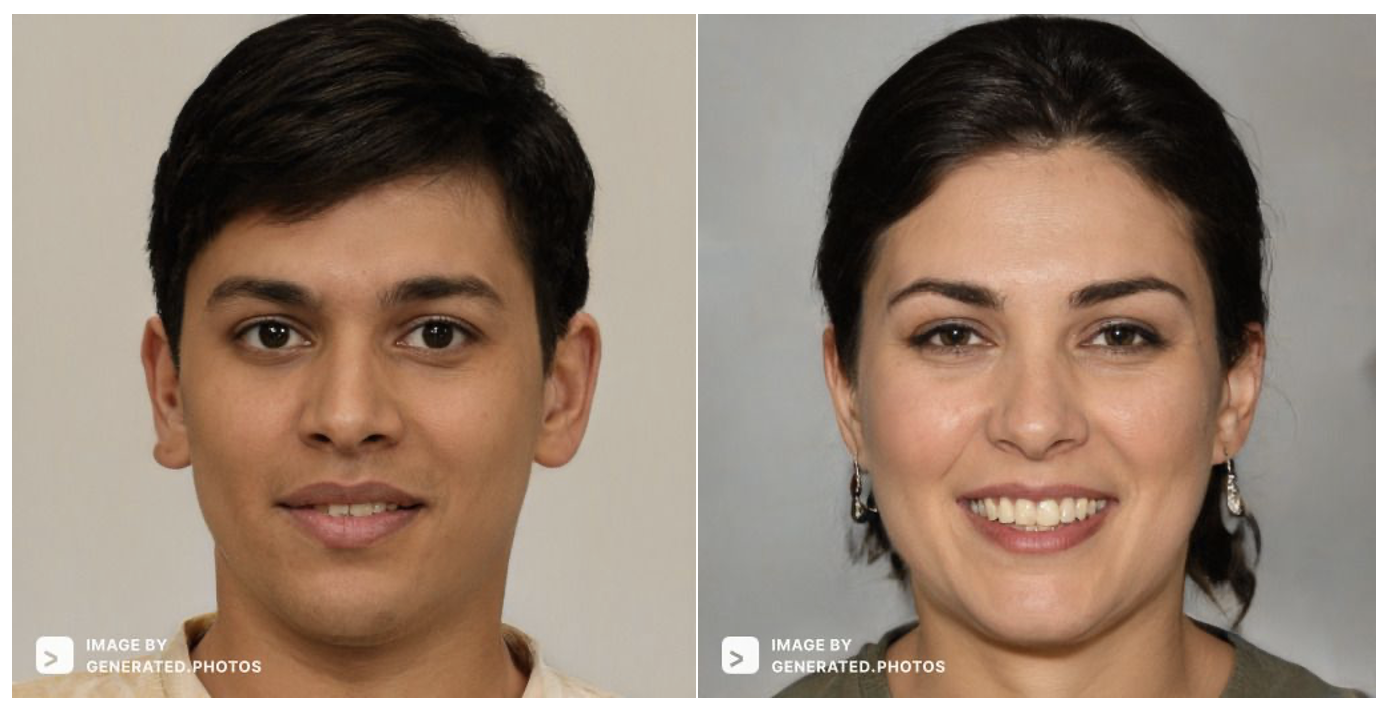
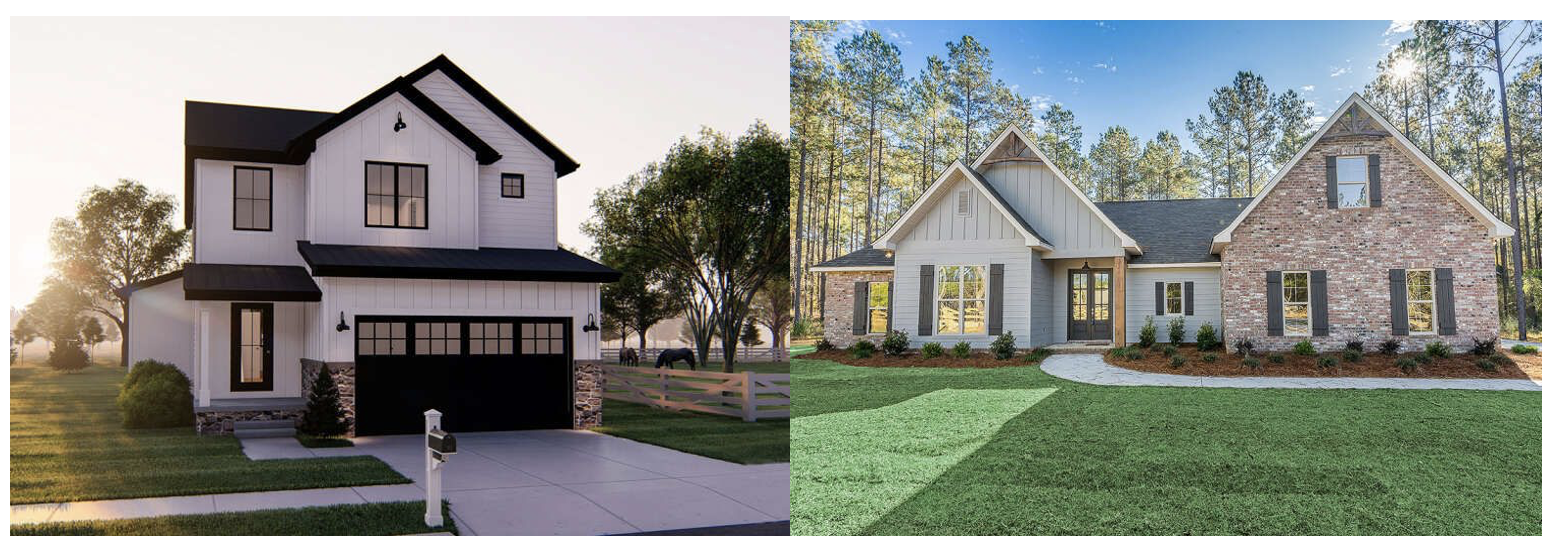
Stimuli: Participants were shown two different types of cue stimuli: social stimuli and non-social stimuli. The social stimuli was a set of images of faces, while the non-social stimuli was a set of images of houses. Participants were then shown the target stimuli: the letter ‘p’ or the letter ‘b.’
Design: This study used a 2 (Image Type: Face/House) x 2 (Congruence: Congruent/Incongruent) x 2 (SOA: Long/Short) x 2 (BAPQ Group: High/Low) mixed model experimental design. The first IV, Image Type, refers to the social and non-social stimuli (images of faces vs images of houses). The second IV was Congruence; that is, whether the ‘p’ or ‘b’ appeared on the same side of the screen as the image that preceded it. The third was SOA; the amount of time between the onset of the cue and target stimuli. The final IV was BAPQ score, in which participants could either score high (meaning they possess higher levels of autism phenotypes) or low (possessing lower levels of autism phenotypes). All IVs were within-group except for BAPQ score, with only one experimental condition. The dependent variable was participants’ reaction time in the ‘p’ or ‘b’ task.
Procedure: Participants were provided with the informed consent form and directed to review and sign the document. Participation in the study lasted approximately 30 minutes on a single day for each participant. Each individual was directed to a computer where they sat to complete the BAPQ, which is a Likert scale self-assessment of behaviors and attitudes that can be indicative of ASD.
Following that, the computerized attention-capture task began. Participants were instructed by text on the screen to focus on a central point on the computer screen as images of faces or houses were flashed off to the left or right. When a ‘p’ or ‘b’ appeared on the screen, participants decided which letter they saw by selecting the corresponding letter on the keyboard.
The experiment included both congruent and incongruent trials. In a congruent trial, the ‘p’ or ‘b’ would appear on the same side of the screen as the image preceding it (as shown in Figure 1). In incongruent trials, the letter would appear on the opposite side of the screen, and the more attention a participant paid to a given image, the longer it would take them to reorient their attention to the ‘p’ or ‘b’ task.
Results
For this experiment, we examined response time (RT) in a 2 (Image Type: Face/House) x 2 (Congruence: Congruent/Incongruent) x 2 (SOA: Long/Short) x 2 (BAPQ Group: High/Low) mixed model using a repeated measures ANOVA, with BAPQ Group as the between-subjects variable. It was hypothesized that the independent variables of BAPQ group and Image Type would have a significant influence on RT. However, no reliable effect was observed in this area.
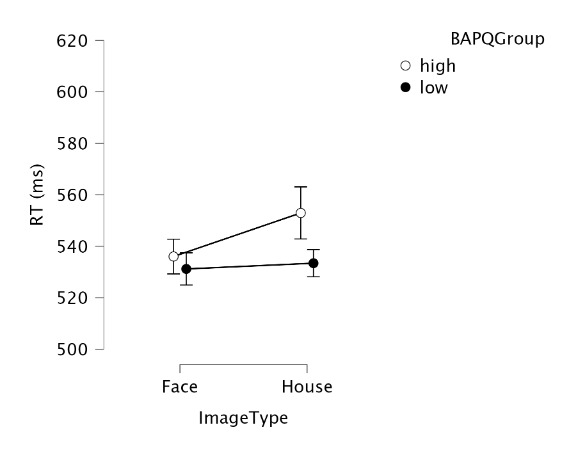
We did observe reliable main effects of Image Type and SOA on RT. The main effect of Image Type, F(1, 64) = 5.25, p = .03, n2p = .08, revealed that people responded more slowly when they saw the non-social stimuli, houses (M = 543, SE = 10), relative to the social stimuli, faces (M = 533, SE = 9). The main effect of SOA, F(1, 64) = 74.6, p < .001, n2p = .54, revealed that people responded more slowly when the SOA was short (M = 563, SE = 10) relative to long (M = 514, SE = 9). No other reliable main effects or interactions were observed.
Discussion
We asked participants to complete the BAPQ screening questionnaire in order to assess their level of autism phenotypes, and then had them complete a computerized spatial orienting task designed to measure their levels of social attention. From these trials, we hoped to discover whether there was a correlation between high or low levels of autism phenotypes and the degree of attention paid to social stimuli. We found that on average, reaction time was slower after participants were presented with the non-social, “houses,” image type, regardless of BAPQ group. There was no statistically significant difference in performance on our spatial orienting task between those with low and high levels of autistic traits. These results are unusual, as they contradict previous findings in the area of autism phenotypes and social attention.
Researchers such as Dubey et al. and Shic et al. have found evidence that individuals’ attention levels for social stimuli typically vary based on whether or not they have ASD, or even based on the degree to which they exhibit autism phenotypes. These studies both support the idea that the fewer autism phenotypes and individual has, the more their attention will be captured by social stimuli. With this in mind, one might expect to see a variety of results on the social attention measure used for this study, with low BAPQ individuals paying the most attention to social stimuli, and those with more autistic traits, even if they are also neurotypical, potentially paying more attention to non-social stimuli comparatively.
There is no singular explanation as to why our participants performed the way they did. However, one viable explanation stems from issues with the validity of our measure of social attention. The existence of a reliable main effect of Image Type, as well as the lack of a main effect of Congruency, support the idea that participants’ reactions were slowed by the nature of the image rather than the placement of it in comparison to the letter shown immediately after. However, we cannot know for certain if the social or non-social nature of the images was the reason for the difference in attention that we observed. It is worth acknowledging that the photos of houses were richer in detail than the close-up images of faces set against neutral-colored backgrounds. Therefore, a possible alternate explanation for the results of this study is that participants were more drawn to the detail-rich image over the less detail-rich image.
Future studies in this vein would do well to control for the level of detail in the stimuli sets used. For instance, using photos of faces that are more dynamic or detail-rich, or using photos of houses or objects that are more plain. One question that arises from this study is at what precise point the detail-richness of an image overpowers social influences when it comes levels of attention paid to different sets of stimuli. How “interesting” can a non-social image be (as far as the level of detail) before this factor is more significant than the social or non-social nature of the image?
It would also be interesting to see more exploration of other influences on social attention aside from ASD and its phenotypes. Existing research has looked at the potential impact of variables such as age, IQ (both verbal and nonverbal), level of social content in a given piece of stimuli, audio input, and attention bids (attempts from others to connect socially with the individual) (Chita-Tegmark, 2016). Yet, little research on autism and social attention seem to look at factors such as the individual’s tendency to be more extroverted or introverted, or other similar factors. Maybe the question of how individuals with and without autism vary in their social attention behaviors is affected not only by the more typical clinical factors that have been studied thus far, but also by personality and disposition. It could be worthwhile and interesting to see how individuals’ social tendencies beyond the clinical level may affect their social attention.
Limitations
In addition to the limitations in the validity of our social attention measure, our sample was limited in terms of sample size and diversity. There were only 66 participants, mostly around the age of 18, predominantly female, and all were enrolled in psychology courses at NMSU at the time of the study. Certainly, such a sample cannot be used to make a judgement about the population as a whole.

